When making your own custom web portal pages and requests, inevitably something will go wrong. This tutorial will help you debug your own portal code.
Table of Contents
Before you start debugging, it’s helpful to understand all the ‘legs’ that your data goes through on its trip from the web portal to the game and back again.
When debugging, we can check along each leg of the journey to make sure that the requests and data are getting where they’re supposed to go.
All major browsers have tools built in to help developers debug their Javascript. This includes:
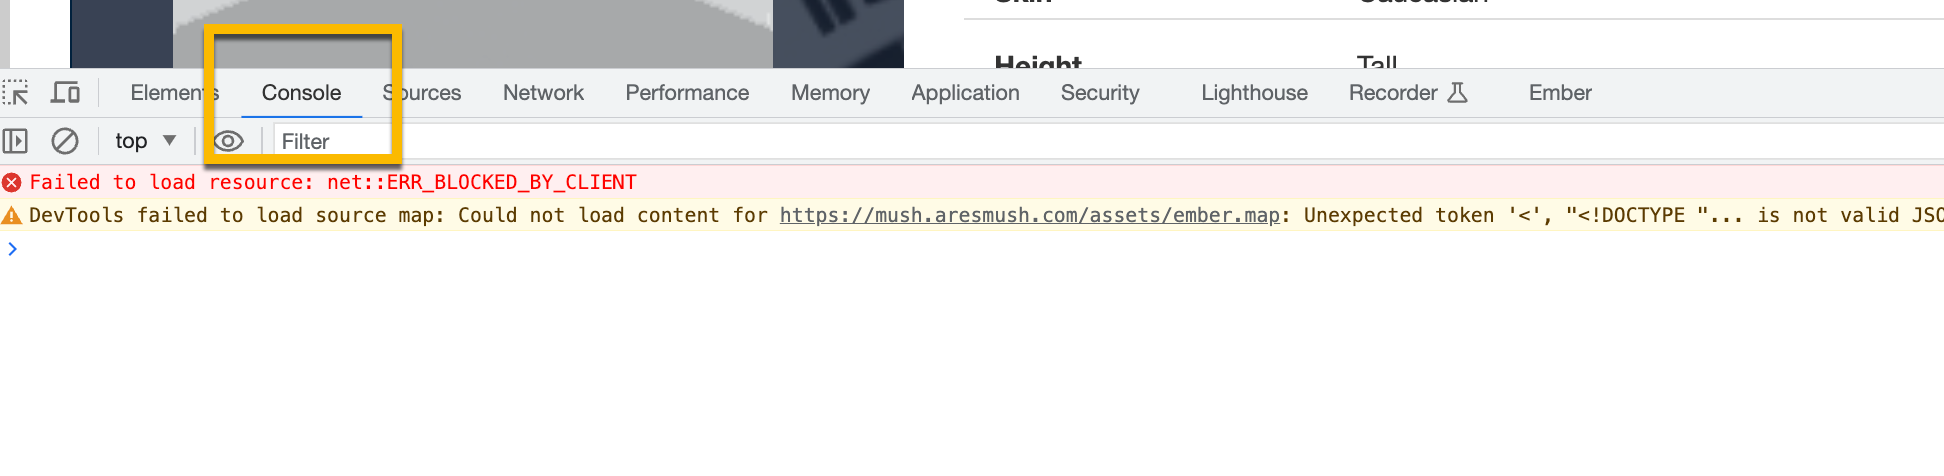
In Chrome, the dev tools are under View -> Developer -> Developer Tools. In other browsers, look for a “Developer” menu (or do a Google search for “(yourbrowser) developer tools”).
If you install the Ember Inspector, your developer tools will include a special Ember tab that helps you debug EmberJS apps like the web portal.
Here are some specific steps to go through when debugging the portal.
Rule out the obvious first.
Put a debug message into the web request handler. This will tell you that the request got routed to your handler properly.
class SomeWebRequestHandler
  def handle(request)
    Global.logger.debug "Got #{request.cmd} #{request.args}"

    # Return your data normally here.
  end
end
Not seeing the message? Make sure there are no typos in the command name, and that your plugin’s get_web_request_handler method is returning the appropriate class.
In your browser’s developer console, you can see the traffic between the game and the browser.
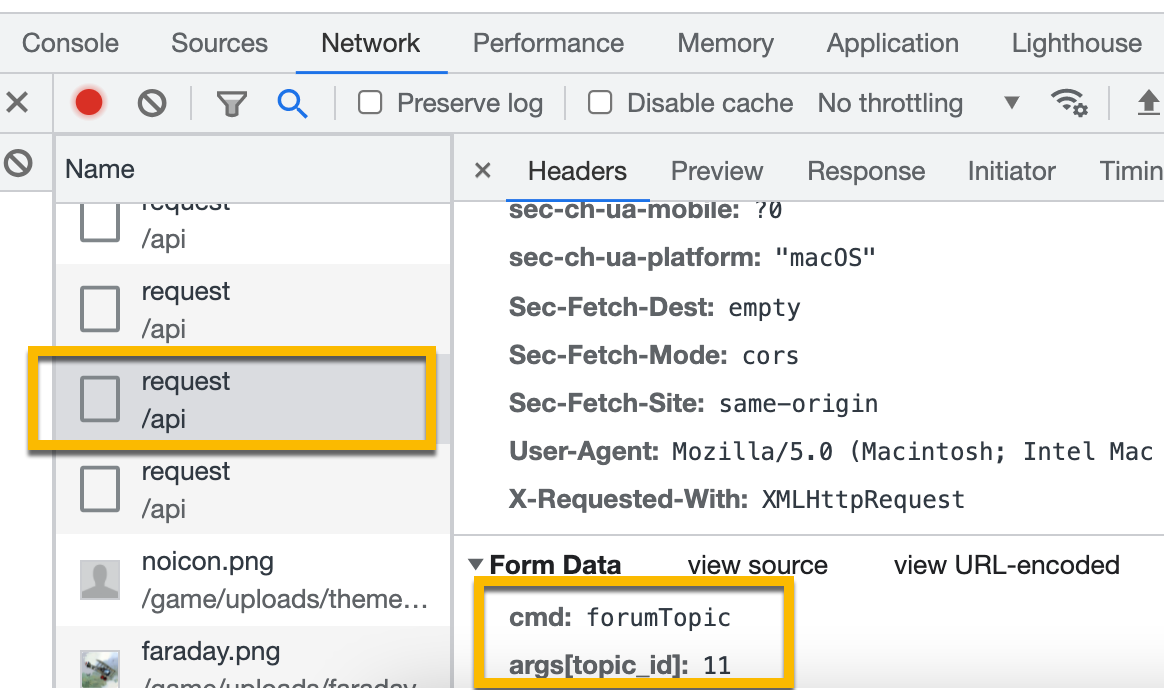
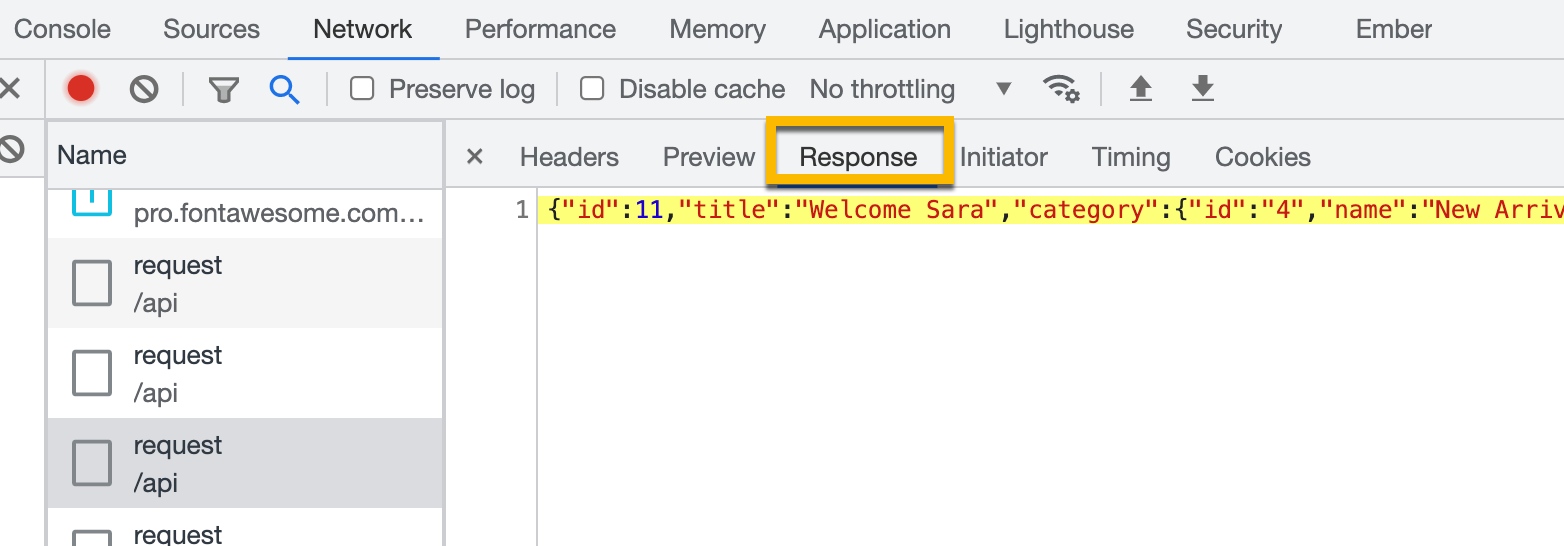
You can see the command arguments in the Form Data section. The response in shown in the “Response” tab as a JSON string. You can use a tool like JSON Formatter to pretty it up.
Common issues to check for:
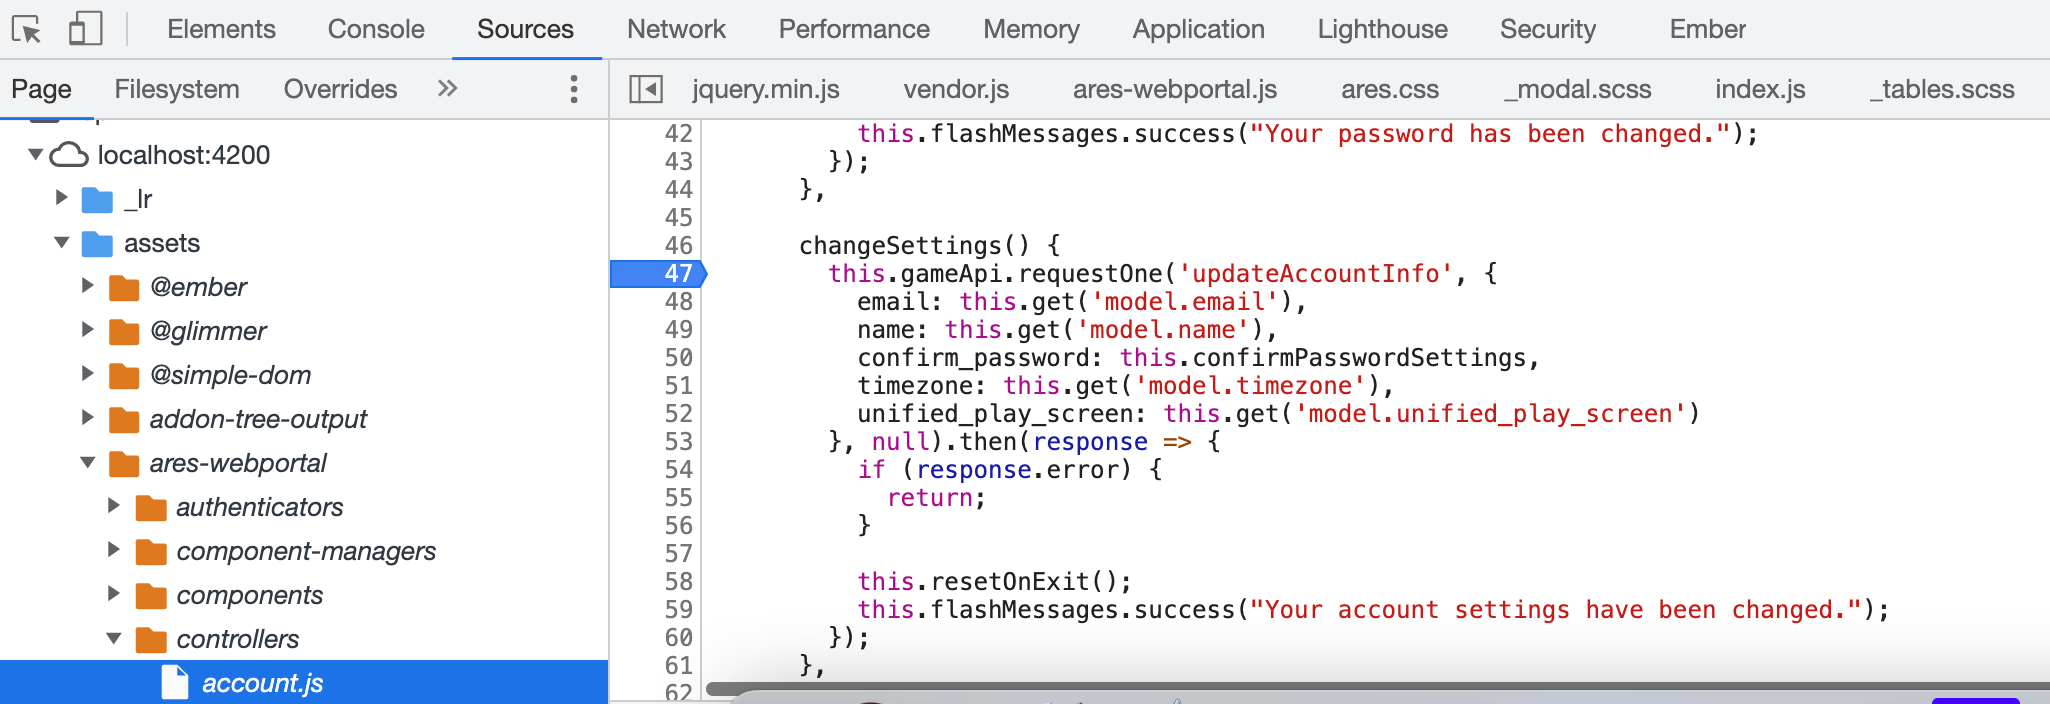
In a controller, you can use a Javascript console.log statement or the browser debugger to step through the code and see what’s going on.
The web portal code is found in the source tab under your hostname (e.g., localhost:4200) -> assets -> ares-webportal. Using the browser tools, you can set breakpoints in controllers/components, and look at variables as the code executes.
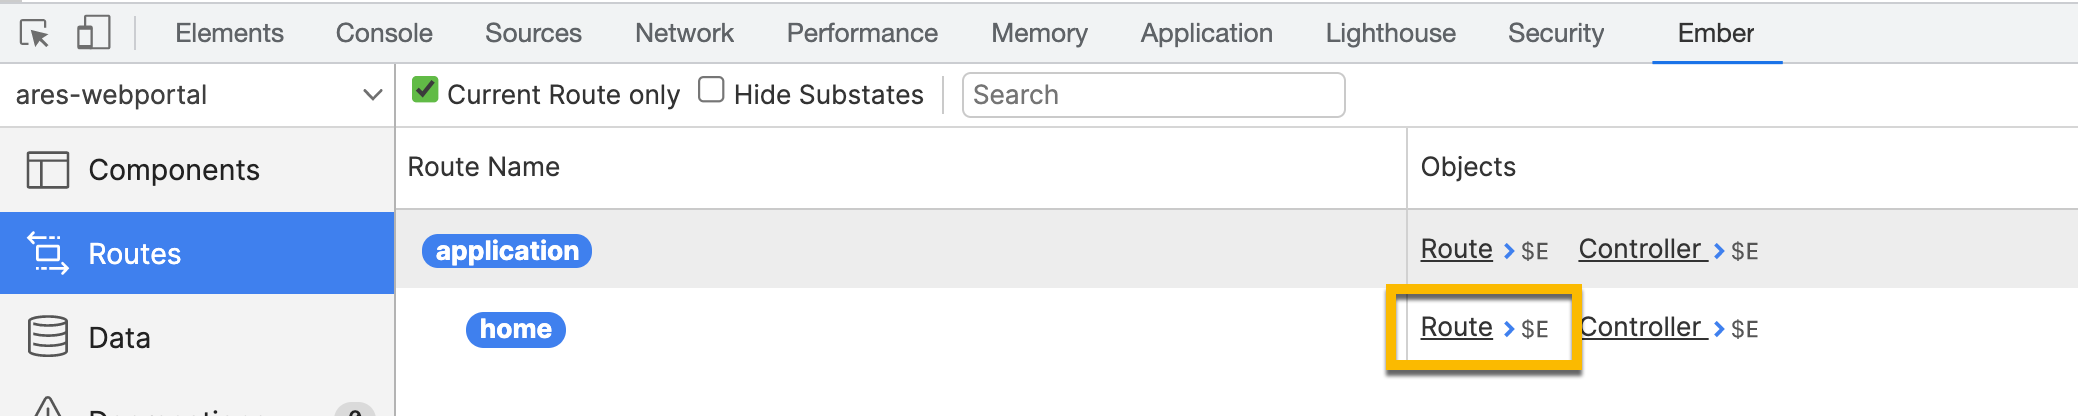
It’s very difficult to debug a route this way. Instead, you’ll want to use the Ember Inspector.
Go to the “Routes” tab, find your route, and click on the little “$E” next to route. This will print out the route’s data to the console.
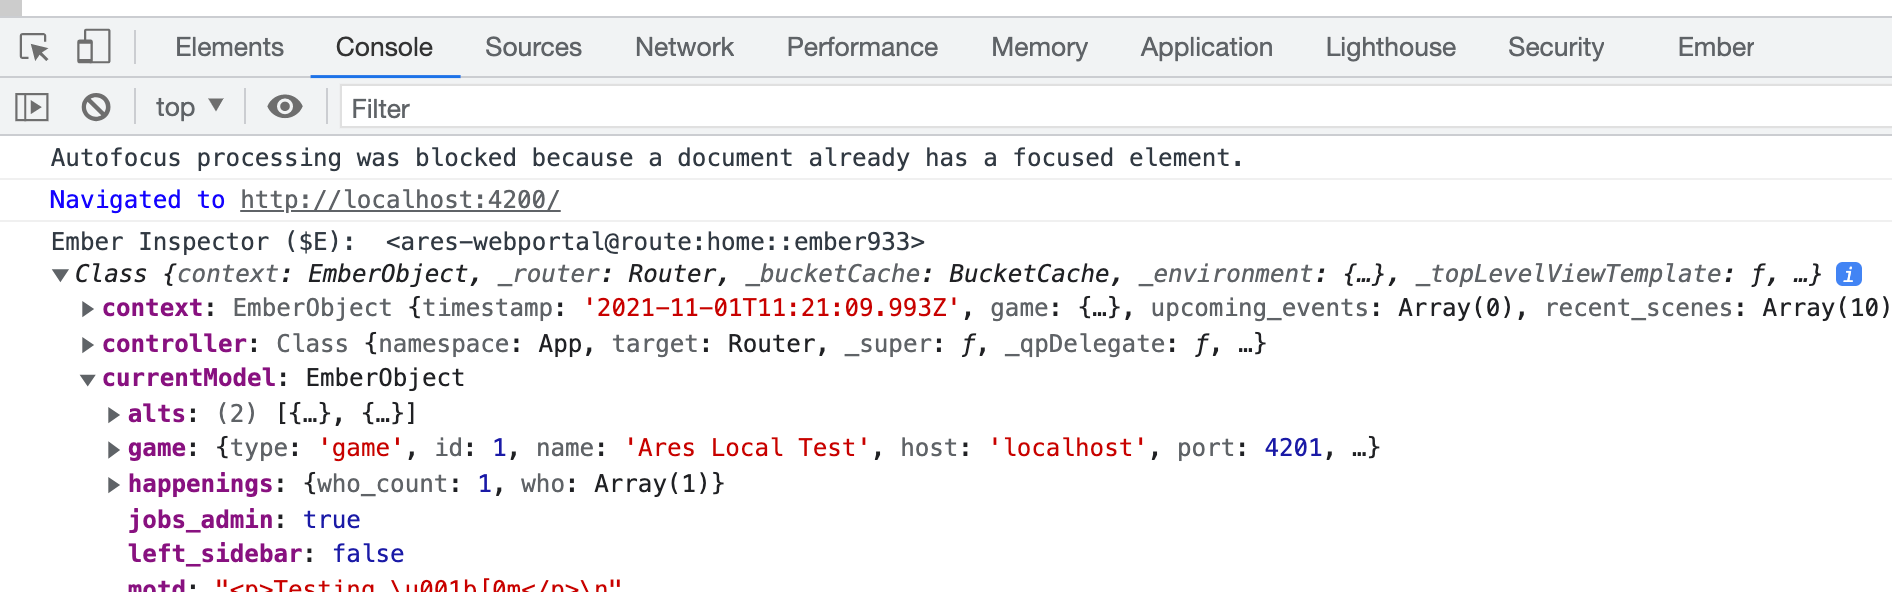
Click the little > next to the Ember console printout to expand the route data. Usually you’ll be looking for the currentModel property, which shows the route’s model.
Common issues to check for:
Finally check the web template for display errors. Try replacing what’s there with a simple “Hello World” string just ot make sure you’re loading the right template page.
Common issues to check for:
this. when accessing variables.model.foo but should be model.char.foo.If you’re running in a local test environment, it can be helpful while testing to run the web portal in Debug Mode, so you don’t have to re-deploy the portal every time you change the code.